Knowing what a spreadsheet is is one thing. But knowing how to use it to make your student life easier is another.
If you are new to spreadsheets, I recommend starting with our beginner guide on how to use a spreadsheet as a student before continuing here. It explains workbooks, worksheets, rows, columns, cells, formulas, and basic calculations.
If you have already learned the basics, you may now be asking:
“Okay, but what can I actually use this thing for?”
A lot.
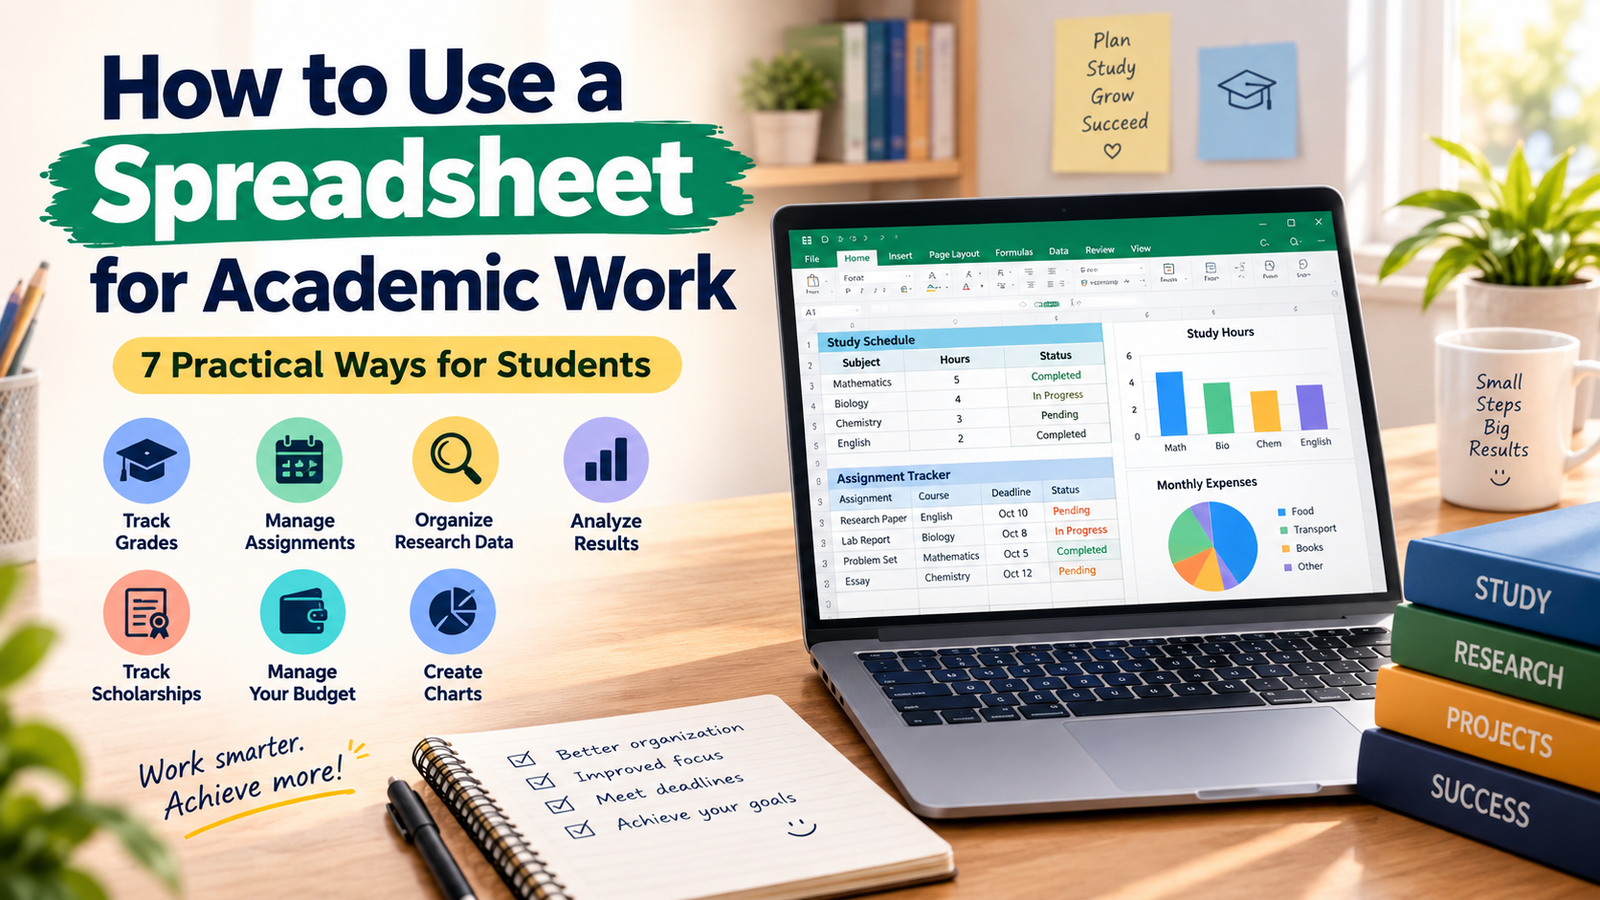
You can use a spreadsheet to calculate your grades, organize research data, monitor assignments, analyze your performance, track scholarship opportunities, manage expenses, and turn large amounts of information into something you can actually understand.
Now let’s move beyond the basics on how to use a spreadsheet for academic work. Whether you’re using Google sheet or Excel this article shows you how you can optimize your academic journey with these software
1. Use a Spreadsheet to Track Your Grades
“The real value of a spreadsheet is not how much information you can put into it, but how much confusion you can remove from your work.”
One of the easiest ways to use a spreadsheet as a student is to monitor your academic performance. And I’m going to show you how to calculate that in real time.
Example, create columns such as:
Course |
Credit Unit |
Assignment |
Exam |
Total |
|---|---|---|---|---|
Mathematics |
3 |
18 |
62 |
80 |
Biology |
3 |
20 |
65 |
85 |
Chemistry |
2 |
17 |
68 |
85 |
English |
2 |
15 |
70 |
85 |
You can then use formulas we discussed on how to use spreadsheet effectively to calculate totals and averages.
But don’t stop at recording your scores.
Use the spreadsheet to ask questions about your performance:
- Which course am I performing best in?
- Which course needs more attention?
- Is my performance improving?
- Which semester produced my highest average?
- Which subjects consistently give me difficulty?
This is the point where your spreadsheet becomes more than a record. It is a tracking tool to monitor your performances, and understand yourself as a student
2. Use a Spreadsheet to Organize Assignments and Deadlines
You can also create an assignment tracker so you don’t miss out on the deadlines.
Example, try these columns:
Assignment |
Course |
Deadline |
Status |
Score |
|---|---|---|---|---|
Essay |
English |
Oct. 5 |
Pending |
|
Lab Report |
Biology |
Oct. 8 |
Submitted |
82 |
Problem Set |
Mathematics |
Oct. 10 |
Pending |
Now you have one place to see what needs to be done and when you need to do it
You can add other columns such as:
- Submission date
- Lecturer
- Priority
- Comments
As your assignments increase, this simple system can prevent important deadlines from disappearing among your notes and messages.
3. Use a Spreadsheet for Research Projects
This is where spreadsheets become particularly valuable if you’re a research student.
Suppose you are conducting a survey involving 100 students.
Instead of keeping the responses in scattered documents where they will be difficult to analyze, you can organize them into a table using a spreadsheet.
Example, you can arrange the data thus:
Participant |
Age |
Department |
Test 1 |
Test 2 |
Final Score |
|---|---|---|---|---|---|
P001 |
21 |
Biology |
70 |
75 |
72.5 |
P002 |
23 |
Chemistry |
65 |
80 |
72.5 |
The basic rule is simple:
Each column should represent one type of information.
Each row should represent one record.
This structure makes your information much easier to sort, filter, calculate, and analyze.
You can effectively use them for:
- Research projects
- Dissertations
- Final-year projects
- Laboratory experiments
- Questionnaires
- Statistical assignments
Instead of staring at a mountain of raw information, you can organize it into a structure that makes patterns easier to identify.
4. Use Spreadsheet Sorting and Filtering to Find Information Quickly
Assuming that your research spreadsheet contains 500 students.
You want to find the students from the Computer Science department.
You don’t need to manually search through all 500 rows to pick out the students you want.
Instead, you can use a filter.
The spreadsheet can temporarily show only the rows matching your chosen condition.
Similarly, you could sort students according to their scores.
For example:
Before sorting
Student |
Score |
|---|---|
David |
62 |
Sarah |
89 |
Michael |
74 |
Grace |
95 |
After sorting from highest to lowest
Student |
Score |
|---|---|
Grace |
95 |
Sarah |
89 |
Michael |
74 |
David |
62 |
This becomes increasingly useful as your dataset increases.
The larger your dataset becomes, the more valuable good organization becomes.
5. Use Charts to Understand Your Academic Results
Sometimes a table of numbers is not enough to analyze your data.
A chart can help you see a pattern much faster than a table would.
Suppose your average scores are:
Semester |
Average |
|---|---|
1 |
61 |
2 |
66 |
3 |
72 |
4 |
78 |
The numbers suggest improvement, though still quite easy to spot because the data in this table is not much.
But assuming the data are much more than this, a chart can make that trend much easier to see. There so many things you can do with the chart:
Use a line chart for trends
A line chart is useful when you want to show change over time.
For example:
- Semester performance
- Monthly study hours
- Attendance over time
Use a bar or column chart for comparisons
These are useful when comparing:
- Course scores
- Expenses you made
- Departments
- Survey responses
Use a pie chart carefully
A pie chart can help show how different categories contribute to a whole.
For example, you might use one to visualize your monthly student expenses:
- Food
- Transportation
- Accommodation
- Books
- Other expenses
But don’t create a chart simply because it looks attractive.
Create it because it makes your information easier to understand.
6. Use a Spreadsheet to Track Scholarships
If you regularly search for scholarships, you already know how quickly opportunities can become difficult to manage.
You may discover one scholarship today and another next week.
Then you start wondering:
“Did I already apply for this one?”
A spreadsheet can give you a simple scholarship tracking system.
Create columns such as:
Scholarship |
Country |
Degree Level |
Deadline |
Funding |
Status |
|---|---|---|---|---|---|
Scholarship A |
Canada |
Master’s |
Nov. 10 |
Fully Funded |
Not Applied |
Scholarship B |
USA |
PhD |
Dec. 1 |
Partial |
Preparing |
You can add an application-link column as well.
Then sort your spreadsheet according to the deadline.
You can also filter it to show:
- Fully funded scholarships
- Master’s scholarships
- PhD scholarships
- Scholarships in Canada
- Scholarships in the United States
- Applications you have started
- Applications you have not submitted
This is particularly useful if scholarship searching has become a regular part of your academic planning.
And if you’re looking for study abroad opportunities, you can combine your spreadsheet with our guide on university scholarships for international students in Canada and use the spreadsheet to record the opportunities you discover.
7. Use a Spreadsheet to Analyze Your Results
Storing information is only the first step.
The bigger question is:
What does the information tell you?
Suppose you recorded your average score across four semesters:
Semester |
Average |
|---|---|
1 |
61 |
2 |
66 |
3 |
72 |
4 |
78 |
You can immediately see a pattern.
Your performance is moving upward.
But your spreadsheet cannot automatically tell you why.
Perhaps you changed your study routine.
Perhaps you started attending classes more regularly.
Perhaps you simply became more comfortable with your courses.
The spreadsheet shows you the pattern.
You investigate the reason.
That is an important distinction.
A spreadsheet can help you organize and analyze information, but you still have to interpret what the results mean.
How to Calculate Academic Scores with Spreadsheet
Students often have courses where assignments, tests, and examinations have different percentages.
Suppose:
- Assignment = 30%
- Examination = 70%
And you scored:
- Assignment = 80
- Examination = 70
Your weighted score is:
=(80*30%)+(70*70%)
The result is:
73%
So, instead of repeatedly calculating this manually, you can put the scores and weights into separate cells and let the spreadsheet handle the calculation.
This becomes especially useful when you have many courses.
Understanding Relative and Absolute References
As you become more comfortable with spreadsheets, you will encounter another useful concept called cell references.
Suppose you write:
=B2*C2
and copy the formula into the next row.
The spreadsheet may change it automatically to:
=B3*C3
This is a relative reference.
Sometimes you want a particular cell to stay fixed.
For example, if B1 contains a value that should be used in every calculation, you can write:
=$B$1
The dollar signs tell the spreadsheet to keep that reference fixed when the formula is copied.
You don’t need to master this immediately.
For now, remember:
Relative reference: the reference can change.
Absolute reference: the reference stays fixed.
Use a Spreadsheet to Manage Your Student Budget
Your academic life isn’t the only thing you can organize.
You can also use a spreadsheet to understand your spending.
Create columns such as:
Date |
Item |
Category |
Amount |
|---|---|---|---|
Oct. 1 |
Transport |
Transportation |
2,000 |
Oct. 2 |
Textbook |
Academic |
8,000 |
Oct. 3 |
Food |
Feeding |
3,000 |
Then use:
=SUM(D2:D20)
to calculate your total expenses.
After several weeks, you may begin to notice where most of your money goes.
That information can help you make better decisions about your student budget.
Spreadsheet Shortcuts Everyone Should Know
You don’t need to memorize every keyboard shortcut.
Start with a few:
Ctrl + C — Copy
Ctrl + V — Paste
Ctrl + X — Cut
Ctrl + Z — Undo
Ctrl + S — Save
Ctrl + F — Find
Ctrl + A — Select all
Ctrl + P — Print
Use them regularly and they will eventually become natural.
A Simple Spreadsheet Project to Test Yourself
Now that you understand the practical uses, try this exercise.
Create a spreadsheet containing five courses:
Subject |
Assignment |
Test |
Exam |
|---|---|---|---|
Mathematics |
18 |
15 |
55 |
Biology |
17 |
18 |
60 |
Chemistry |
20 |
16 |
58 |
English |
16 |
17 |
65 |
Physics |
19 |
14 |
52 |
Then:
- Add a Total column.
- Calculate the total for each course.
- Calculate your overall average.
- Find your highest score.
- Find your lowest score.
- Calculate the percentage for each course.
- Create a chart comparing your scores.
If you can complete those tasks yourself, you are no longer simply reading about spreadsheets.
You are using one.
Mistakes to Avoid When Using Spreadsheets for School
A spreadsheet can make your work easier, but it can also make mistakes harder to notice if you are careless.
Always check your formulas.
Keep your column headings clear.
Don’t mix unrelated information in the same column.
Don’t manually overwrite calculated values unless you have a reason.
And most importantly, keep backups of important academic files.
A spreadsheet containing months of research data is too valuable to leave in only one location.
Learn to Work With Information
The most important thing you can gain from learning spreadsheets isn’t memorizing SUM or AVERAGE.
It is learning how to take information that looks messy and turn it into something useful.
You collect the information.
You organize it.
You calculate what you need.
You look for patterns.
Then you use what you have learned to make better academic decisions.
That is why spreadsheet skills can become surprisingly valuable during university.
“Good spreadsheet work is not about making more numbers; it is about making the numbers easier to understand.”
Effective Use of Spreadsheet for Academic Work
You don’t need to become a data analyst before a spreadsheet becomes useful to you.
Start with your own academic life.
Track your grades.
Organize your assignments.
Record your research data.
Monitor your expenses.
Keep track of scholarship opportunities.
Then learn to sort, filter, calculate, and visualize the information you have collected.
If you haven’t mastered the basics yet, go back to our guide on how to use a spreadsheet as a student and work through the fundamentals first.
Once those basics become comfortable, these practical applications will become much easier.
And eventually, the spreadsheet will stop being a collection of confusing boxes.
It will become what it was supposed to be from the beginning:
a tool that helps you work smarter, understand your academic information, and stay more organized.
1 thought on “How to Use a Spreadsheet for Academic Work: 7 Practical Ways for Students”